

A new study using old concepts to estimate critical speed
Using actual performance to deduce physiological limits

Before getting to the study…
Critical speed (and for cycling/rowing: critical power) is one of the most interesting exercise metrics we have. In general, it tells us the boundary between hard but sustainable exercise intensities and very hard and unsustainable intensities.
I wrote about it more in depth in a previous article.
It basically it represents a metabolic tipping point. When you’re running slightly slower, physiology is operating in a steady state (demand for energy = supply of energy). Oxygen consumption and lactate are elevated but invariant with time. Critical speed is the fastest steady state pace our physiology can handle.
Run slightly faster than critical speed, even by just 10%, and steady state is broken. Oxygen consumption will progressively increase towards VO2max, lactate will progressively increase until volitional exhaustion, pH continues to fall with time, and so on.
Relevance for exercise research
Historically, exercise prescription in research uses % VO2max or % maximal heart rate, because we assume this normalizes the intensity across people of different fitness levels. It doesn’t!
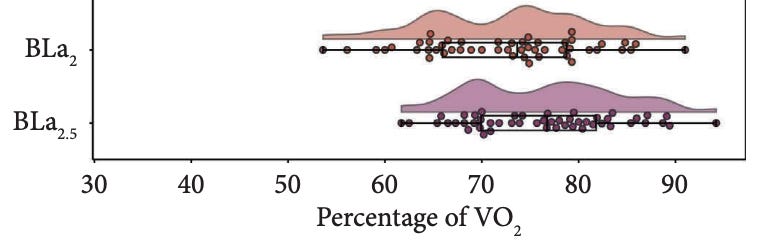
Across the spectrum of fitness, there can be very heterogenous responses to exercising at a given percentage of VO2max, which you can see below:
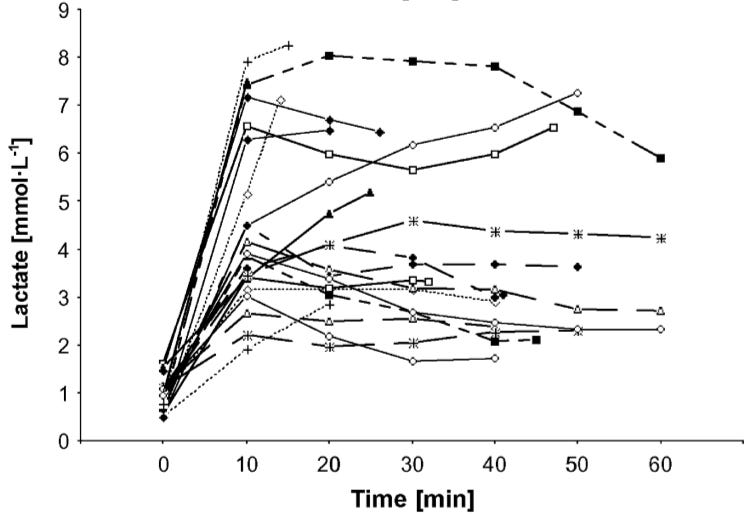
There was up to a 4-fold difference in blood lactate between people exercising at the “same” intensity!
A classic study from Ed Coyle’s lab in the 80’s also showed this in highly-trained cyclists all with similar VO2max’s but different lactate thresholds. Those with a high vs low threshold could cycle at 88% VO2max for about twice as long (~70 vs ~35 min, if memory serves) with half the rise in blood lactate.
Same VO2max, different capacities. But how?
It’s because our first metabolic threshold (LT1 or VT1) and critical speed occur at different percentages of VO2max depending on our fitness, or endurance, driven by the cellular, molecular, and structural adaptations to training.
Metabolic thresholds denote distinct changes in muscle metabolism as intensity rises and can range from ~50 to 90% VO2max. These local metabolic changes determine how our cardiopulmonary system responds (pump more blood, breathe heavier), how hard something feels, and is the basis of training zones. As such, they are proxies for metabolic stability and stress that allows us to infer how long a workload can be tolerated, and the metabolic signaling responses for training adaptations.
This concept has been the source of major critiques of many training studies because if you dose the exercise as % maximal heart rate or % VO2max, the metabolic and molecular exercise responses that subsequently drive adaptations will likely differ. That is, unless all of your subjects have exactly the same VO2max, lactate threshold, and critical power (good luck with recruiting!).
One of many examples of where this becomes problematic is looking at the mechanisms underlying responders vs non-responders to physical training. Someone who responds versus not may have simply gotten a higher dose of training because the prescribed intensity was above threshold.
This is why there has been a push to prescribe exercise relative to an individuals thresholds because it normalizes the metabolic stress. In the case of moderate intensity training prescription, this would be having people train at 90% lactate threshold versus 65% VO2max or 75% maximal heart rate.
To illustrate, one recent study had people do moderate (44% maximal power output for 40min) or high intensity interval training (4x4min intervals at 80% maximal power output) for 8 weeks. Before and after they measured VO2max and critical power.
Both groups saw increases on average, but there was a huge variation in individual responses, ranging from -5% to 25% for VO2max and +4% to +61% for critical power.
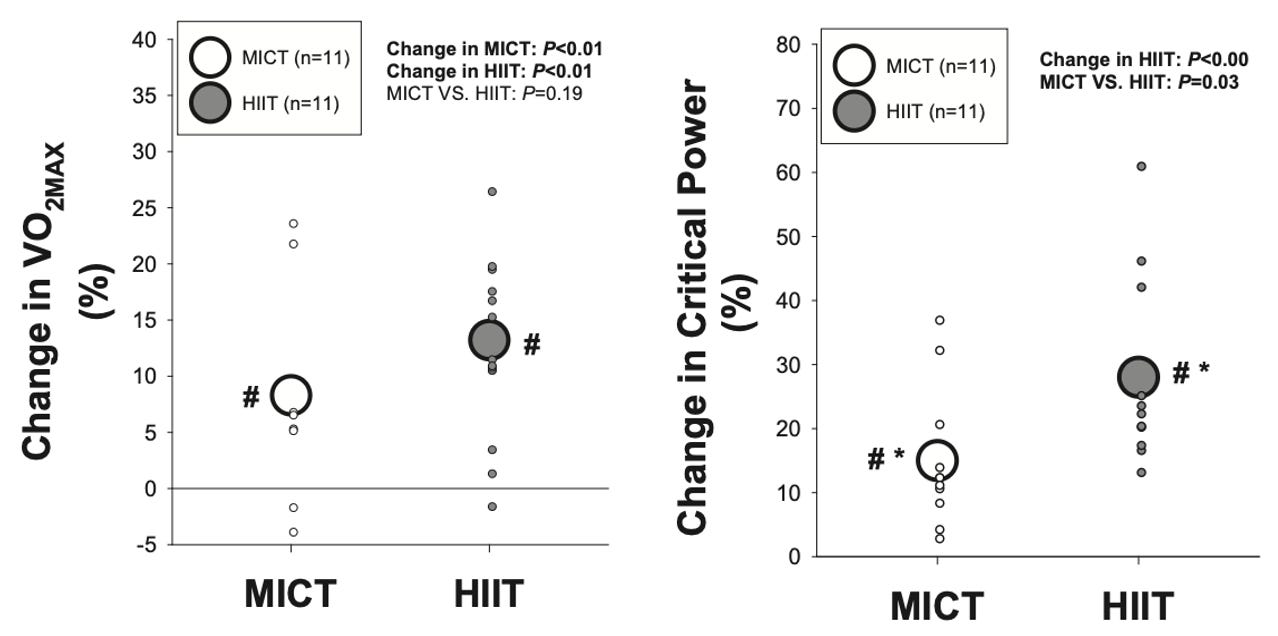
None of that is interesting by itself and aligns with other research: HIIT is a more potent stimulus, and adaptations vary a lot between people. The interesting part came from a secondary analysis where they went and determined each persons highest prescribed training intensity as a % of their baseline critical power.
Remember, training was prescribed as % of maximal power output. So if your maximal power is 300 watts, critical power is 180 watts, and got put in the MICT group (44% maximal power = 132 watts for 40 min/day), you were training at 73% of critical power. Someone else in the study could have the same maximal power but a critical power of 230 watts, which means they were training at 56% critical power, but still 44% maximal power.
If you look at the graph on the left below, you can see this exact scenario in 2 of the subjects which I circled in red.
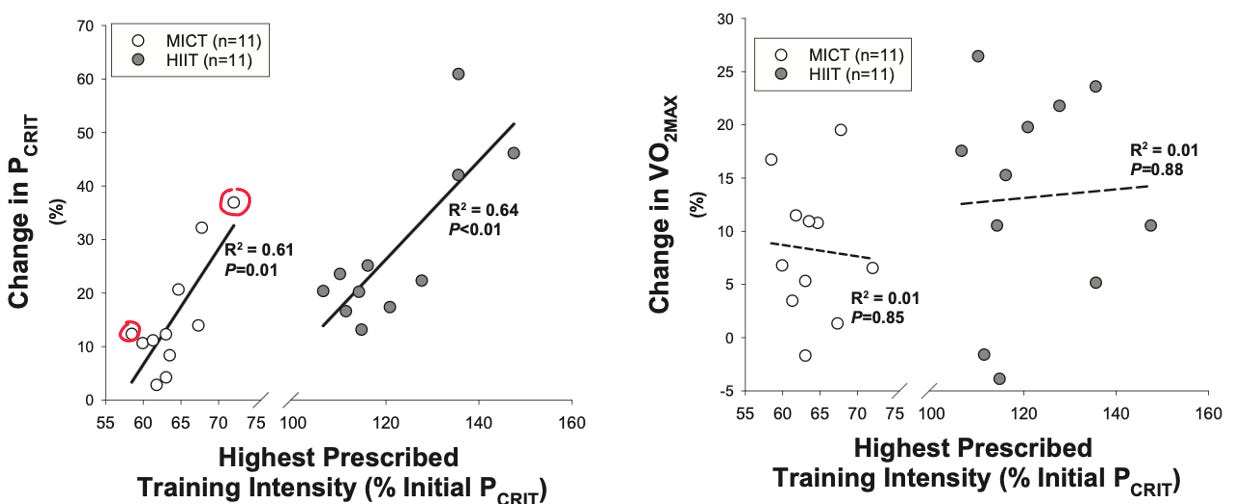
The training-induced change in critical power was linearly related to how close the intensity was to critical power. It explained over 60% of the variance: the higher % of critical power you train at, the better your critical power gets. It makes sense, but clearly the prescription strategy of % maximal power/VO2max does not normalize the training response. Interestingly, this did not account for the variability in VO2max adaptations (figure on the right).
That was a long detour before I get into the main study I wanted to highlight. But, I wanted to drill down on the concept that critical power is a relevant metric that we could/should be anchoring training to in research studies since unlike % VO2max, it seems more capable of delivering a more homogenous training response.
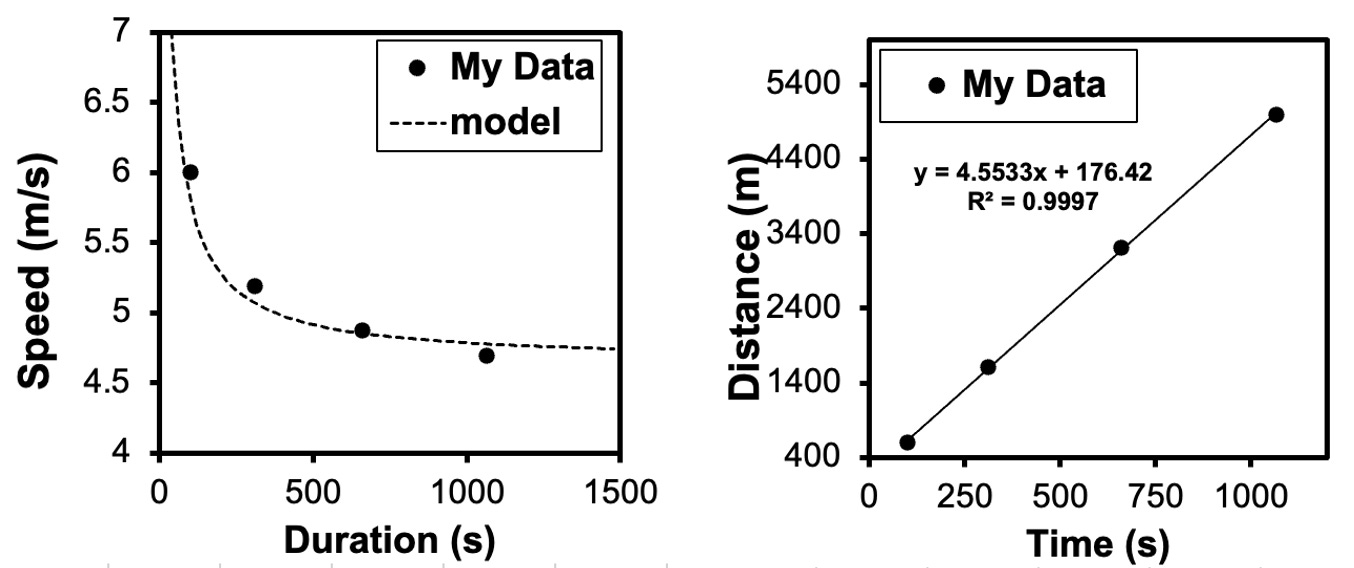
Calculating critical speed
Obtaining critical speed is the most annoying part of the whole concept. It requires several (~4) maximal effort time trials between 2 and ~20 minutes to build out a speed-duration curve using mathematical modeling. As you can expect, most people don’t have time for this.
A recent study tried to streamline this and calculate critical speed from only 1 previous race performance. The authors used a pretty clever approach and I wonder why no one has thought of this before, including myself. They leveraged the classic 1979 book by the legendary Jack Daniels (RIP) titled Oxygen Power: Performance Tables for Distance Runners.
The book is the basis of the VDOT system — tables which take a recent race time and then predict performances for other distances based on the calculated VDOT value. VDOT units are conveniently quite similar to VO2max, although they aren’t the same. Consider it a running performance index that integrates the oxygen cost of running (derived from lots of lab testing) and the length of time a given % of VO2max can be sustained (also derived from lab testing).
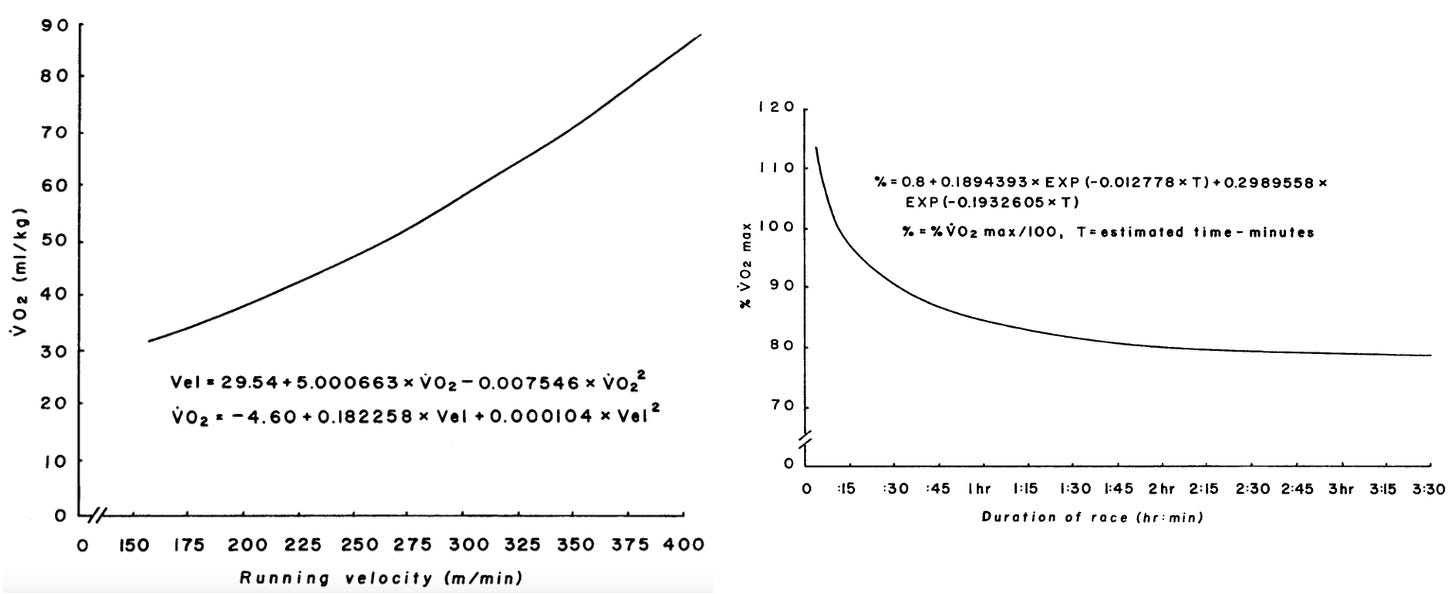
You plug in a recent race performance, see what your VDOT is, then can see what your predicted times in other distances would be. When I do this with my own data using a recent half-marathon time of 1:15:53, the equivalent times down to the mile are quite accurate.
I was able to find a pdf online relatively easily at one point, but you can also read the brief Appendices of the book here which explain how the tables were constructed and science behind the predictions. Fortunately, there is also a convenient online calculator.
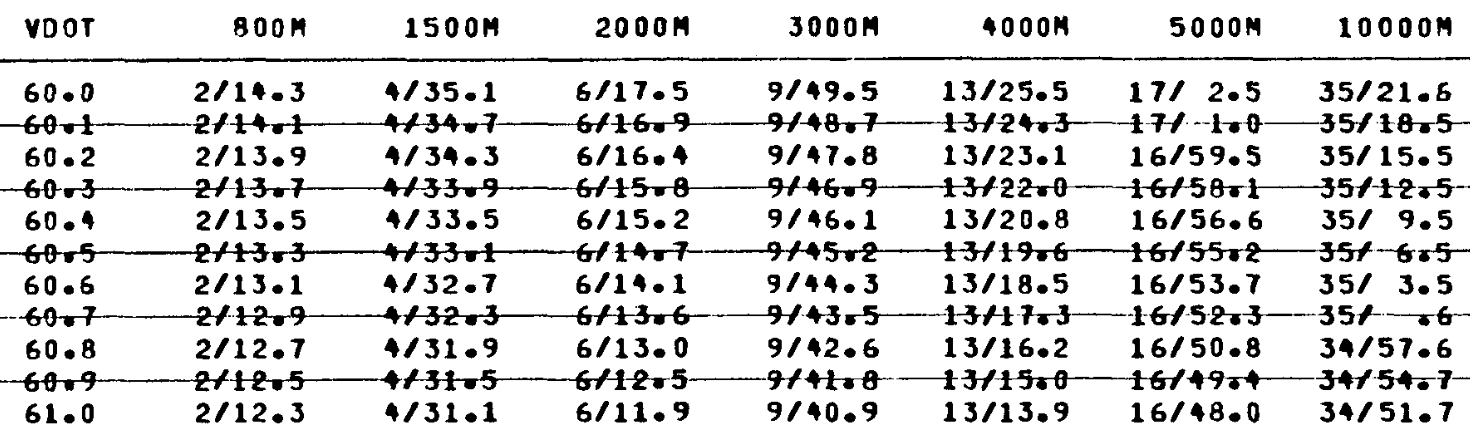
The authors condensed the original VDOT tables to 6 common distances between 1500m and the marathon (42km) in VDOT rows between 40-85 ml/kg/min (46 rows). They then calculated critical speed based on predicted race times within each VDOT value for the 1500m, 3km, and 5km distances, producing 46 critical speeds. The authors basically said “empirically these tables/times are pretty accurate, so the critical speed results should be able to apply to anyone”. In this case, “anyone” refers to those with a VDOT between 40 and 85.
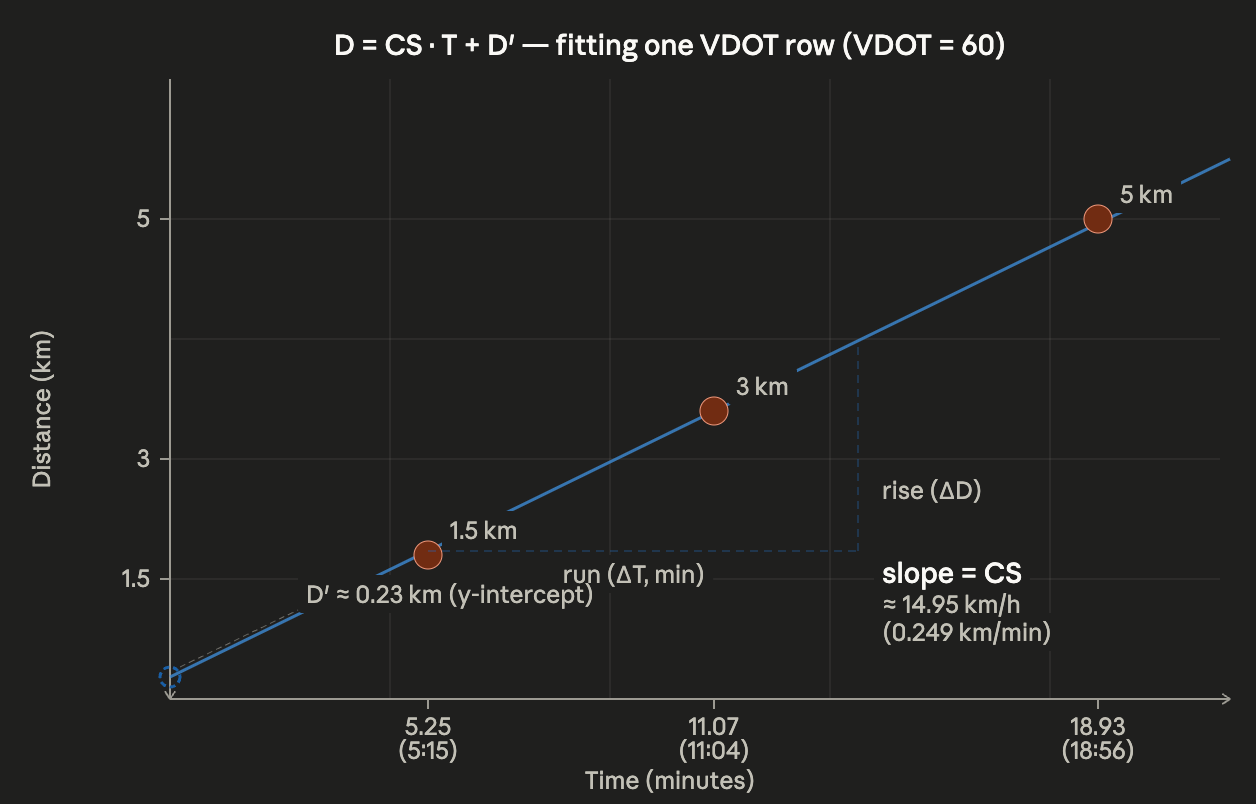
Next, they did a regression of the calculated critical speed against each of the 6 race distances time columns.
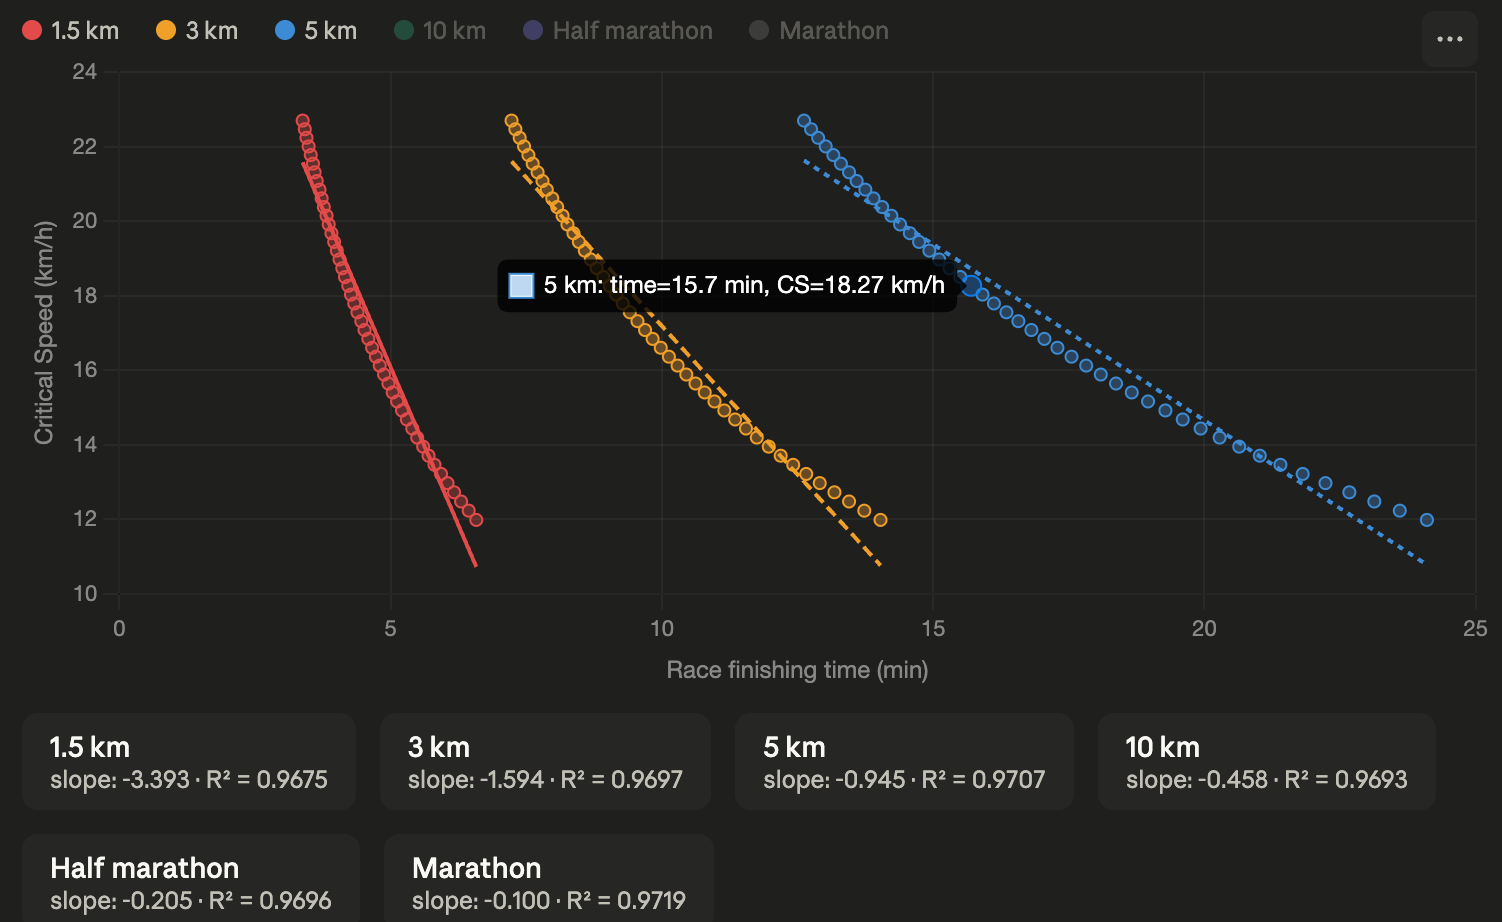
The above figure/math produces 6 equations that predict critical speed based on predicted performance time from the Daniels’ tables. The result from their paper:
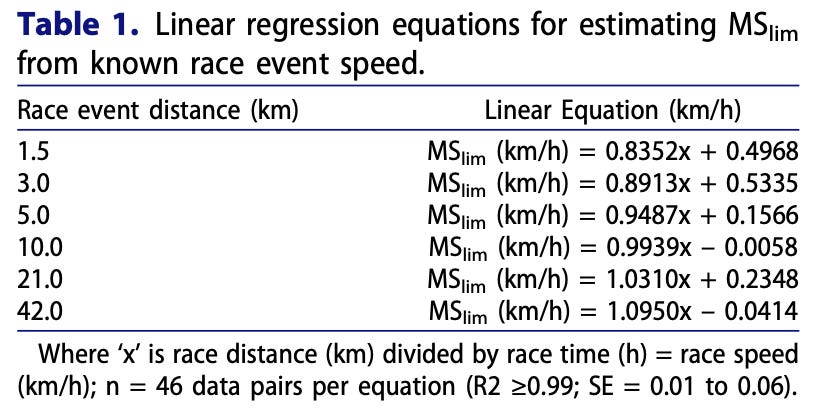
So, you plug a recent race performance into the equations above and get an estimate of critical speed, or more accurately, “metabolic stability”. When they had several runners run at self-selected speeds between 60-90% of the resulting value, they always achieved steady state or metabolic stability as measured by oxygen uptake. When they ran at 110% of the resulting value, all of them fatigued and had to stop running within 3.5 minutes.
While the Daniels’ tables aren’t exactly perfect, and the equations won’t give you a precision estimate of critical speed, this is a great practical tool to use in research when understanding the upper end of metabolic stability matters (per the example I provided earlier), assuming your subjects have run one of these race distances recently. At the very least it can be used as a gut check to say “we definitely don’t want you going above X mph because we know it won’t be sustainable”.
I should also say that I used the half-marathon equation from this paper a few weeks before a 10 mile race to guide some of my interval workouts. It came out to 5:36/mile pace and felt exactly what “threshold” should feel like. At my current fitness a 10 miler is run pretty much right on the nose of critical speed/metabolic stability, maybe a few percent slower, and I ran the race at an average pace of 5:40/mile. At mile 8 I tried to surge to 5:30 pace and immediately sensed impending doom / burning my final matches, so settled back in at 5:40 until a much later kick at the end. So while anecdotal the data aligned pretty well for me.