LDL-cholesterol (LDL-C) isn’t related to human performance per se, but it’s definitely relevant towards overall health, and you can argue being overall healthier allows you to train more for performance. There are some differing thoughts out there on what is optimal for LDL-C as it relates to things like mortality risk and heart disease. Below I highlight two different viewpoints on the topic. One camp suggests “lower is better” while a 2023 study suggests that an LDL-C above what we think as normal is actually best.
A recent study1 reported that the optimal LDL-C is 140mg/dL with levels below or above that increasing all-cause mortality. Most blood panels flag an LDL-C as high when it is 100mg/dL, so this result is obviously intriguing. In contrast, others suggest lower is always better, with the optimal range between 50-70mg/dL.2
Which view is correct? Why does it matter?
A Primer on LDL-C
Cholesterol is a vital lipid and its levels in the blood are due its manufacturing by our own cells, rather than coming from dietary cholesterol3. Since it is hydrophobic (repels water), it needs help moving through blood, unlike water-soluble salt or sugar. Lipoproteins act like cargo ships, transporting cholesterol and other lipids as their cargo.
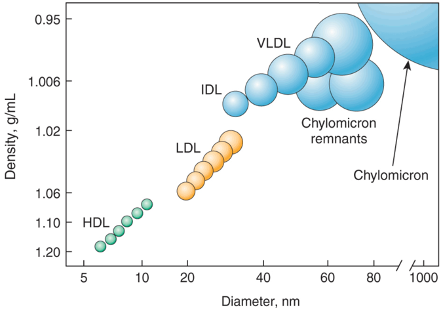
Lipoproteins have different densities, determined by the proportions of lipid and protein (see Figure 1 below). LDL is our main cholesterol carrier,4 transporting cholesterol from the liver to other tissues and back, and LDL-C is how much cholesterol is inside LDL.

LDL-C has a close relationship with atherosclerotic cardiovascular disease (ASCVD), the process of cholesterol-rich lipoproteins clogging blood vessels.5 In fact, paraphrasing an article in Cell Metabolism: “Elevations of plasma LDL produce atherosclerosis in every mammalian species ever studied”.6
Normally, LDL gets cleared from circulation by the liver, but sometimes it makes a permanent pit-stop in an artery, initiating atherosclerosis. The more LDL, and the longer we have it, creates more chances for it to sneak in artery walls. Given that CVD is the leading cause of death globally and in the USA, LDL research is highly relevant.
Is there a sweet-spot for LDL-C?
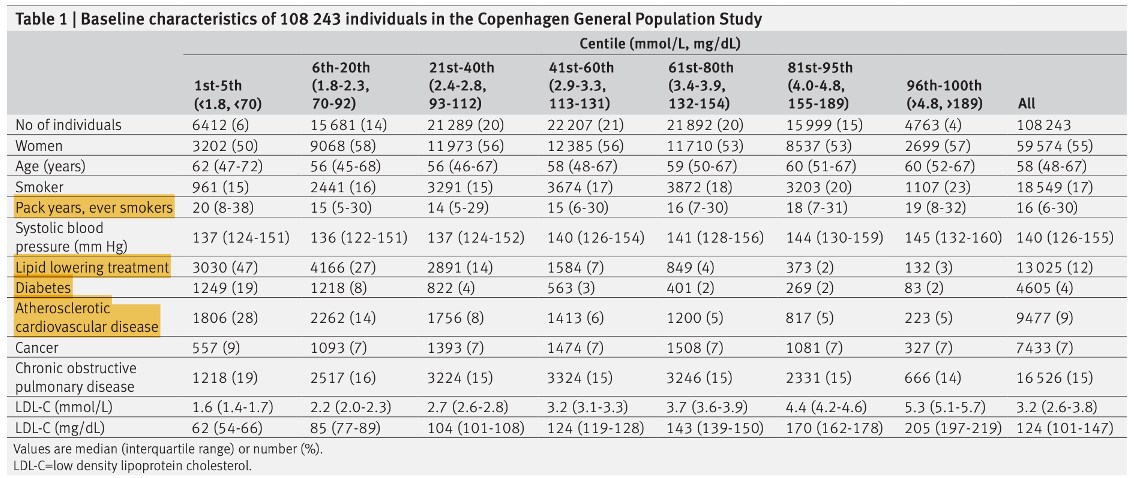
A study in Denmark1 took 108,243 people between the ages of 20-100, collected a non-fasted blood sample at baseline and other health information (Table 1), and tracked them for 9.4 years to record mortality rates and the association with baseline LDL-C. Patients were grouped based on the percentile of their LDL-C and compared to the group with lowest mortality.
Mortality risk was calculated using hazard ratios (HRs) accompanied by 95% confidence intervals (CIs). If the HR is 1.2 with a 95% CI of 1.10-1.30, we can be 95% confident risk will be increased somewhere between 10-30%. Precise and reliable CIs have a narrow range and don’t cross 1.0 (e.g., 0.8-1.2).

They controlled for confounding variables such as sex, age, blood pressure, and presence of disease, obtained from a national database. Smoking, lipid-lowering drugs, and diabetes were included, but self-reported (notoriously inaccurate).
Controlling for confounders is like noise-cancelling headphones. They cancel out the noise (smoking) and let you hear what you want more clearly (LDL-C). However, this still may let some residual noise in, termed residual confounding. Further, several other important variables were unknown, such as body weight (influences both LDL-C and mortality) which can lead to unmeasured confounding.
To account for the natural variation in LDL-C over time, it was measured twice, 10 years apart, in a subgroup of healthy, disease-free subjects not taking medication to calculate the regression dilution ratio (RDR) which corrects for that variation. Ideally, this improves your statistical model when you only have 1 baseline blood sample and yields more accurate HRs.
However, this assumes all patients follow that pattern, which may not hold for those with disease or on medication. Importantly, the lowest LDL-C group had the most people with current disease and taking lipid-lowering medication.
What did they find?
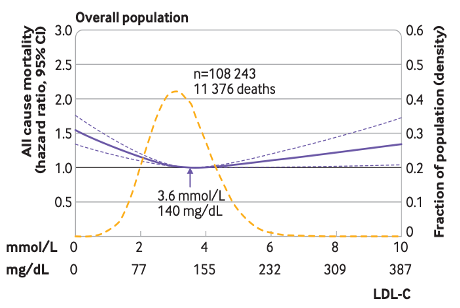
In the overall population, an LDL-C of 140mg/dL had the lowest risk of all-cause mortality. Above or below 140, risk increases, producing a U-shaped curve (Figure 2). In those on lipid-lowering drugs, the optimal LDL-C was much lower (89mg/dL) with no U-shape. While others have found similar results,7 there are some caveats.

There was no association between LDL-C and cardiovascular mortality. LDL-C is a causal risk factor for ASCVD,4,5 so it seems implausible it would be related to all-cause but not cardiovascular mortality, which is in sharp contrast to prospective studies with longer follow up (26.5 years).8 They did find that risk of having and dying from a heart attack increased as LDL-C increased. This is like saying, “You’re risk for dying from any cause is lowest at 140mg/dL, but a lower level will protect you from dying of a heart attack specifically”.
Some obvious concerns include: 1) It was an observational study (meaning you can’t determine cause-and-effect), 2) they only measured LDL-C once at baseline, 3) we don’t know their body weight, 4) patients were all white and from one country and 5) changes in lifestyle or medication use during follow up are unknown. We do know that statin use in Denmark increased 62-fold from 1996-2015,9 which encompasses this study.
Further, the low LDL-C group was much sicker. Half were on lipid-lowering drugs, 1-in-5 had diabetes, 1-in-3 had ASCVD already, and they smoked more. These variables had a big effect because when they included confounders in the model, the difference in mortality was much less comparing the low and optimal LDL-C groups. While this was controlled for, the authors admitted it is unclear whether the results are due to residual confounding.
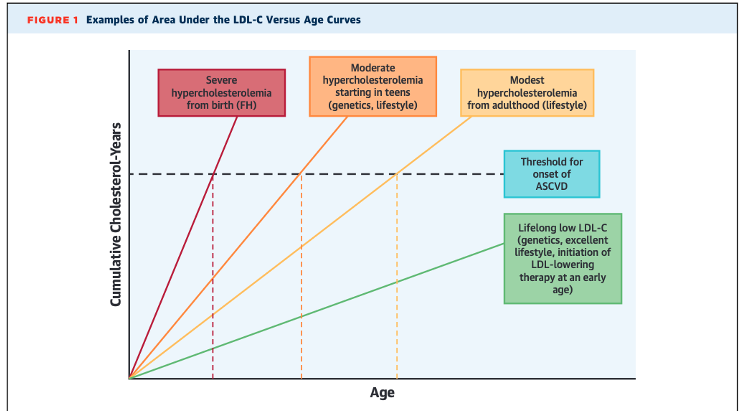
Keep in mind that cumulative LDL-C exposure influences ASCVD10 and levels in people on lipid-lowering medications do not reflect lifelong exposure. This disproportionately affected those with low LDL-C because 47% were on medication compared to 4% in the “optimal” group. In short, someone could have had high LDL-C for many years and went on medication to reduce it. Their new LDL-C puts them in a lower group to start the study, but their accumulated risk up to that point isn’t magically erased, potentially making it seem that low LDL-C increases risk.
They adjusted for this by assuming statins decreased LDL-C by 30-40%, estimating what baseline LDL-C might have been without medication. However, this doesn’t account for dosage differences, adherence, type of statin, altered drug effectiveness over time, and individual variation.
There’s also reverse causation, implying LDL-C was low because of other comorbidities. In fact, low serum cholesterol is a marker of frailty.12 So yes, maybe more people with a low LDL-C had an increased risk of death, but was it caused by low LDL-C? Or their other health issues?
The U-shape is also misleading. The lowest LDL-C group had LDL-C of 54-66mg/dL, but the figures show predicted HR’s above and below what was actually observed. Coincidentally, the U-shape becomes the most dramatic at LDL-C levels that are sparsely populated with people (yellow line in Figure 2), along with increasingly wide 95% CI’s, both of which create uncertainty.
Is lower better?
First, I would encourage you to visit Table 1 of this article, showing that LDL-C satisfies the 8-step criteria for a cause-and-effect relationship with ASCVD.5 As far as consistency, >200 studies with >2 million people show a dose-dependent relationship between LDL-C and ASCVD.
O’Keefe et al., who promote 50-70mg/dL as optimal, point out that hunter-gatherers and non-human primates (genetically similar to us) have LDL-C in the range of ~40-80mg/dL and virtually no ASCVD.2 In average adults that level is ~130mg/dL and 40-50% have ASCVD by age 50. You might say, “okay but that doesn’t imply cause-and-effect either”.
When they aggregated ~20 human clinical trials comparing statins to placebo in terms of atherosclerosis progression and coronary heart disease events (e.g., heart attacks), they found a direct relationship with LDL-C. This means that when intentionally decreasing LDL-C (or not, if given placebo) and following patients for multiple years, the magnitude of atherosclerosis and number of heart attacks decreases the more that LDL-C decreases.

Further, people can have genetic conditions gifting them a low LDL-C for their entire life (as low as 30mg/dL) which is associated with improved longevity and without adverse effects. Two years after their article, another mutation was found that reduces LDL-C and ASCVD by as much as ~90%.6 Even though the LDL-C reduction can sometimes be similar to that of statins, the decreased ASCVD risk is substantially higher, likely because LDL-C is lower for the entire lifespan rather than only after statin therapy begins (usually in middle age).
Scientists later developed a drug mimicking this mutation, known as a PCSK9 inhibitor. In a randomized controlled trial of people already taking statins, LDL-C was further reduced to 30mg/dL while significantly reducing cardiovascular death and heart attacks compared to placebo.13 Importantly, there were no adverse events (low LDL-C didn’t cause any health issues).
Take-home
CVD is the #1 killer globally, and LDL-C is crucial for determining CVD risk, so knowing what optimal levels are is tremendously important. To date, there is far more supporting evidence that low LDL-C (50-70mg/dL) is optimal and is not dangerous. This includes observational data, randomized controlled trials, and insights from human genetics. Observational studies are important, but the recent Denmark study has obvious limitations and flies in the face of decades of research.
We shouldn’t discount results simply because they are different, but their conclusion of rethinking our understanding of what a healthy LDL-C is, and when to start treatment, is illogical. For that to be true, we need more observational studies that are not confounded, clinical trials showing 140mg/dL is optimal, and even genetic studies following that pattern, because that is what we have supporting the “lower is better” viewpoint.
References
1. Johannesen CDL, Langsted A, Mortensen MB, Nordestgaard BG. Association between low density lipoprotein and all cause and cause specific mortality in Denmark: prospective cohort study. BMJ. 2020;371:m4266. Published 2020 Dec 8. doi:10.1136/bmj.m4266
2. O'Keefe JH Jr, Cordain L, Harris WH, Moe RM, Vogel R. Optimal low-density lipoprotein is 50 to 70 mg/dl: lower is better and physiologically normal. J Am Coll Cardiol. 2004;43(11):2142-2146. doi:10.1016/j.jacc.2004.03.046
3. KEYS A. Human atherosclerosis and the diet. Circulation. 1952;5(1):115-118. doi:10.1161/01.cir.5.1.115
4. Borén J, Chapman MJ, Krauss RM, et al. Low-density lipoproteins cause atherosclerotic cardiovascular disease: pathophysiological, genetic, and therapeutic insights: a consensus statement from the European Atherosclerosis Society Consensus Panel. Eur Heart J. 2020;41(24):2313-2330. doi:10.1093/eurheartj/ehz962
5. Ference BA, Ginsberg HN, Graham I, et al. Low-density lipoproteins cause atherosclerotic cardiovascular disease. 1. Evidence from genetic, epidemiologic, and clinical studies. A consensus statement from the European Atherosclerosis Society Consensus Panel. Eur Heart J. 2017;38(32):2459-2472. doi:10.1093/eurheartj/ehx144
6. Goldstein JL, Brown MS. A century of cholesterol and coronaries: from plaques to genes to statins. Cell. 2015;161(1):161-172. doi:10.1016/j.cell.2015.01.036
7. Rong S, Li B, Chen L, et al. Association of Low-Density Lipoprotein Cholesterol Levels with More than 20-Year Risk of Cardiovascular and All-Cause Mortality in the General Population. J Am Heart Assoc. 2022;11(15):e023690. doi:10.1161/JAHA.121.023690
8. Abdullah SM, Defina LF, Leonard D, et al. Long-Term Association of Low-Density Lipoprotein Cholesterol With Cardiovascular Mortality in Individuals at Low 10-Year Risk of Atherosclerotic Cardiovascular Disease. Circulation. 2018;138(21):2315-2325. doi:10.1161/CIRCULATIONAHA.118.034273
9. Mortensen MB, Falk E, Schmidt M. Twenty-Year Nationwide Trends in Statin Utilization and Expenditure in Denmark. Circ Cardiovasc Qual Outcomes. 2017;10(7):e003811. doi:10.1161/CIRCOUTCOMES.117.003811
10. Domanski MJ, Tian X, Wu CO, et al. Time Course of LDL Cholesterol Exposure and Cardiovascular Disease Event Risk. J Am Coll Cardiol. 2020;76(13):1507-1516. doi:10.1016/j.jacc.2020.07.059
11. Shapiro, M, Bhatt, D. “Cholesterol-Years” for ASCVD Risk Prediction and Treatment. J Am Coll Cardiol. 2020 Sep, 76 (13) 1517–1520. https://doi.org/10.1016/j.jacc.2020.08.004
12. Ranieri P, Rozzini R, Franzoni S, Barbisoni P, Trabucchi M. Serum cholesterol levels as a measure of frailty in elderly patients. Exp Aging Res. 1998;24(2):169-179. doi:10.1080/036107398244300
13. Sabatine MS, Giugliano RP, Keech AC, et al. Evolocumab and Clinical Outcomes in Patients with Cardiovascular Disease. N Engl J Med. 2017;376(18):1713-1722. doi:10.1056/NEJMoa1615664
Sean Langan has his PhD in exercise physiology and currently works as a research physiologist. He is interested in endurance and strength training, and harnessing the intersection of human physiology, technology, research, and coaching to improve human performance. Sean writes about various topics specific to his personal interests and observations, but if there is anything specific you would like to see please contact him.


